Greek Hospitality Industry Performance - 1st Quarter 2011
Introduction
This newsletter provides a snapshot of the performance of Greek hotels based on a sample of more than 180 hotels & resorts in Greece. The hotel performance data is complemented by data from other sources so as to place the Greek hospitality industry in the context of Greek tourism and of the International Hospitality Industry. Finally, the outlook of the industry, as seen by hoteliers themselves, is given.
% Change in International arrivals1 in Greek airports, 2011 compared to 2010
Region |
% Change Q1 |
% Change YTD Q1 |
| Athens |
-8.3% |
-8.3% |
| Thessaloniki |
-4.9% |
-4.9% |
| Rest of Greece |
7.0% |
7.0% |
Source: SETE, processed by GBR Consulting
% Change in RevPAR2 in Greek hotels, 2011 compared to 2010
Region |
% Change Q1 |
% Change YTD Q1 |
| Athens |
-4.3% |
-4.3% |
| Thessaloniki |
-11.1% |
-11.1% |
| Resort |
23.7% |
23.7% |
Source: GBR Consulting
RevPAR in Competitive Destinations, 2011 compared to 2010
Region |
% Change Q1 |
% Change YTD Q1 |
| S. Europe |
8.2% |
8.2% |
| Rome |
5.5% |
5.5% |
| Madrid |
3.4% |
3.4% |
| Cairo |
-49.8% |
-49.8% |
Source: STR Global, processed by GBR Consulting
Commentary
- International arrivals by air showed a decrease for the two main cities of Greece, Athens and Thessaloniki of -8.3% and -4.9% respectively. This is mainly due to March, where the drop was the biggest: -17.5% and -11.0% respectively, possibly as a result of the continuing flight of MICE activity from both cities due to the negative image of the country in 2010.
- In terms of RevPAR the developments for Athens and Thessaloniki were also negative with a drop of 4.3% for Athens and 11.1% for Thessaloniki. The resort hotels, however, started the year very positively with a growth of 23.7% in RevPAR for Q1. Of course, many seasonal resort hotels remain closed but, according to the 2011 Q2 Barometer of GBR Consulting (see below), resort hoteliers expect a strong improvement in performance this year. The Athenian hoteliers are also very positive in their outlook for occupancy, but expect a decrease in ARR. Their collegues in Thessaloniki are less optimistic: they expect a slight increase in occupancy overall, but a steep decrease in their prices. Crete hoteliers were the most optimistic of all in terms of their outlook for occupancy and ARR.
- These results are confirmed by a survey by The Travel Agents Association of Crete showing winter bookings for this summer increasing by 2 – 4% from Western Europe and 3% - 10% from Eastern Europe. The unrest in North African countries has contributed to this result according to the Association. Note though should be taken that 50% of all bookings are expected to take place during the summer period.
- Finally, the Southern European hotel market is recovering showing RevPAR increases of 8.2% in
2011 Q1. Cairo hotels, due to the unrest in the country, saw their RevPAR decline by 50%.
Hotel & Other News
- According to the Hellenic Statistical Authority (ELSTAT), Greece received 0.6% more arrivals by non residents in 2010 than in 2009. It is interesting though that Europe, responsible for 88.5% of all arrivals in 2010, showed a decline of 2.4% compared to 2009, with arrivals from EU members showing a decline of 6.3%. The largest drop was shown by the UK (-14.7%), Germany (-13.8%), France
(-9.8%) and Italy (-9.8%). The biggest increase was shown by Poland (+97.6%), Russia (63.5%) and Cyprus (32.2%). Asia showed an increase of 5.8% and America 4.6%. Overall, the main source markets of 2010 remained Germany (13.6%) followed by the UK (12%), France (5.8%) and Italy (5.6%).
- Provisional estimates by the Bank of Greece for tourism receipts by non residents were positive for the first two months of 2011 showing an increase of 6.1%. Nevertheless, at € 290 million, they remain 7.2% below the 2009 figures.
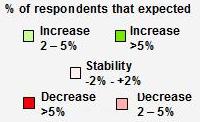
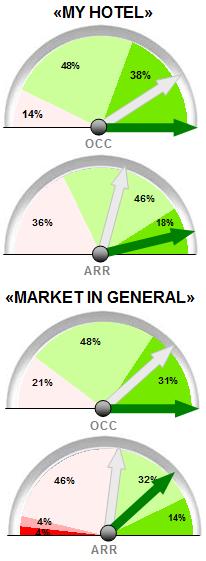
Barometer
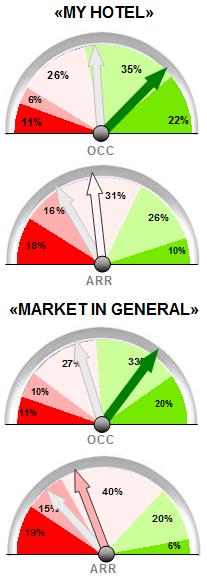
- For their own hotels, 47% expects a rise of 2% or more in occupancy, while a similar rise for the market as a whole is predicted by 53%. In addition 26% expects that their occupancy will stabilise, while 27% expects this for the market as a whole. In terms of ARR, hoteliers have become less pessimistic. However, overall hoteliers still expect a slight decrease of their rates, while for the market as a whole they expect a considerable drop, albeit less than 2011 Q1 forecasts.
- Exception to the above are the 2* hotels, who retain their pessimistic outlook for both occupancy and ARR. Crete remains the most optimistic destination, with increased optimism for both indicators.
2* Hotels
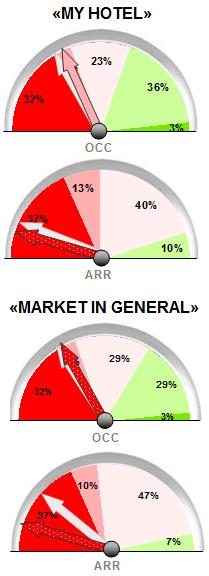
Hotels in Crete
Endnotes
1 The international arrivals statistics are based on SETE calculations compiling the data from 13 major airports of Greece, representing 95% of foreigners' arrivals by plane in Greece and 72% of total foreigners' arrivals. Thessaloniki airport does not distinguish between arrivals of Greeks and foreigners.
2 RevPAR : Revenue per Available Room; for Greek resorts, calculations are based on TRevPAR (i.e. Total RevPAR).
Download this issue as:
- PDF (298 kb)
Back to newsletter