Greek Hospitality Industry Performance - 3rd Quarter 2011
Introduction
This newsletter provides a snapshot of the performance of Greek hotels based on a sample of more than 180 hotels & resorts in Greece. The hotel performance data is complemented by data from other sources so as to place the Greek hospitality industry in the context of Greek tourism and of the International Hospitality Industry. Finally, the outlook of the industry, as seen by hoteliers themselves, is given.
% Change in International arrivals1 in Greek airports, 2011 compared to 2010
Region |
% Change Q3 |
% Change YTD Q3 |
| Athens |
-0.5% |
-2.1% |
| Thessaloniki |
13.1 |
12.3% |
| Rest of Greece |
12.5% |
14.0% |
Source: SETE, processed by GBR Consulting
% Change in RevPAR2 in Greek hotels, 2011 compared to 2010
Region |
% Change Q3 |
% Change YTD Q3 |
| Athens |
6.9% |
4.3% |
| Thessaloniki |
5.4% |
-0.2% |
| Resort |
11.4% |
10.2% |
Source: GBR Consulting
RevPAR in Competitive Destinations, 2011 compared to 2010
Region |
% Change Q3 |
% Change YTD Q3 |
| S. Europe |
7.9% |
9.0% |
| Rome |
9.5% |
7.8% |
| Madrid |
12.4% |
3.2% |
| Cairo |
-48.6% |
-51.1% |
Source: STR Global, processed by GBR Consulting
Commentary
- International arrivals continued their positive trend (see also below) with the exception of Athens showing a YTD Q3 of -2.1%, which is an improvement though compared to the -3.0% of YTD Q2 and the -8.3% YTD Q1. Thessaloniki and the other main airports of Greece showed robust performance in the third quarter resulting in +12.3% YTD Q3 for Thessaloniki and +14.0% YTD Q3 for the rest of Greece. The positive Q3 results can be ascribed to what are expected to be record arrivals in 2011.
- In terms of RevPAR the Resort hotels performed at a +11.4% in their peak season Q3 resulting in an overall YTD Q3 performance of +10.2%. The city hotels recovered somewhat in the third quarter as YTD Q3 for Athens now stands at +4.3% in terms of RevPAR, while YTD Q2 showed a +2.9%. Also Thessaloniki further improved and landed in Q3 almost on par with the same quarter last year, showing a -0.2% for YTD Q3, while this number in Q2 was still -4.1%.
- Finally, Rome and Madrid improved their performance in Q3 compared to Q2, while Cairo remains operating at about half the RevPAR of 2010.
Hotel & Other News
- Based on the latest Bank of Greece data, Greece saw a 6.5% increase in international tourism receipts from € 2,233 mn in August 2010 to € 2,378 mn in August 2011. This increase was not as robust as June and July (+13.4% and +16.7% respectively), but it is clear that the tourism sector is performing very well in these troubled times for the country and despite numerous problems. YTD August, Greece had € 704 mn more receipts from tourism, representing an increase of 10%, totalling € 7,718 mn.
- It is also interesting to see that the EU 27 contributed € 5,270 of these receipts, showing an increase of 6.4%. The major growth though came from other countries, responsible for the remaining € 2,448 in receipts, showing an increase of 18.8%. In this segment Russia showed a growth of 46.6%.
- Not only the receipts increased by 10%, also the non-residents' arrivals rose at an average annual rate of 9.9%, according to the Bank of Greece's border survey for the period January – August 2011. It is positive that the Germans are returning to Greece with an increase of 13.3%, who also spent 11.8% more compared to the same period last year. On the other hand the British arrivals declined by 6.9%.
- Beyond August, we are less positive for City tourism as people are influenced by images of riots in Athens and tourists carrying their luggage due to taxi strikes. Furthermore, winter destinations rely almost exclusively on domestic tourists, who have been seriously hit by the economic crisis. The GBR Tourism Barometer confirms this (see below).
- The prospects for next season are uncertain, due to a worsening economic climate in general, the possible revival of countries of North Africa and the problems in Greece overall. The GBR Tourism Barometer on the outlook for next season (2012) shows a mixed picture (see below) with resort hotels being upbeat and city hotels downbeat.
Barometer
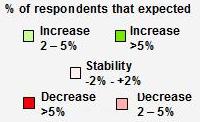
- In our Tourism Barometer survey for 2011 Q4, City Hoteliers have become clearly pessimistic for Q4 in terms of occupancy as well as ARR. Athenian hotels are the most pessimistic, while hoteliers in Thessaloniki expect similar occupancy levels as last year, while they are also very pessimistic on the development of their ARR this quarter in comparison to last year.
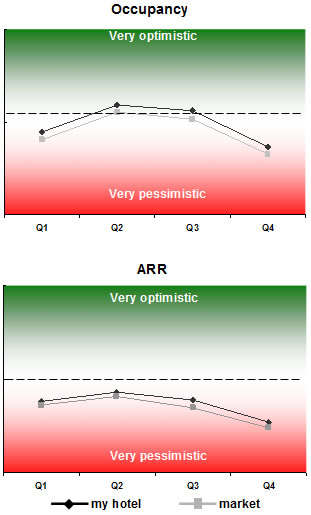
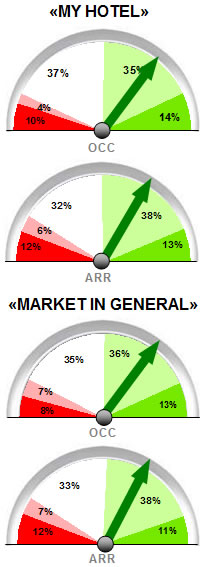
- Resort Hotels, on the other hand, are overall rather optimistic regarding 2012, as shown below, both in terms of Occupancy and ARR. Especially the 5 and 4 star resort hotels are optimistic, while the 3 star hoteliers expect a similar performance in 2012 and the 2 star a decrease for both measured items.
Resort Hotels
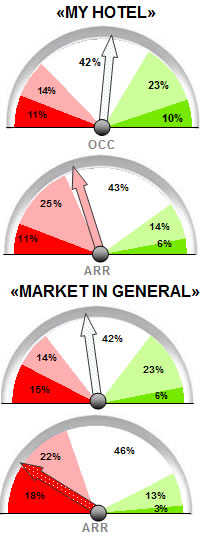
- The city hoteliers are clearly less optimistic for 2012 especially with respect to ARR development, where they expect a decline for their own hotel and a clear drop for the market overall. Occupancy is expected to stabilise for their own hotel, while for the market a slight decrease is expected.
City Hotels
Endnotes
1 The international arrivals statistics are based on SETE calculations compiling the data from 13 major airports of Greece, representing 95% of foreigners' arrivals by plane in Greece and 72% of total foreigners' arrivals. Thessaloniki airport does not distinguish between arrivals of Greeks and foreigners.
2 RevPAR : Revenue per Available Room; for Greek resorts, calculations are based on TRevPAR (i.e. Total RevPAR).
Download this issue as:
- PDF (257 kb)
Back to newsletter