Greek Hospitality Industry Performance - 4th Quarter 2011
Introduction
This newsletter provides a snapshot of the performance of Greek hotels based on a sample of more than 180 hotels & resorts in Greece. The hotel performance data is complemented by data from other sources so as to place the Greek hospitality industry in the context of Greek tourism and of the International Hospitality Industry. Finally, the outlook of the industry, as seen by hoteliers themselves, is given.
% Change in International arrivals1 in Greek airports, 2011 compared to 2010
Region |
% Change Q4 |
% Change YTD Q4 |
| Athens |
-12.8% |
-3.6% |
| Thessaloniki |
6.8% |
11.3% |
| Rest of Greece |
12.1% |
13.9% |
Source: SETE, processed by GBR Consulting
% Change in RevPAR2 in Greek hotels, 2011 compared to 2010
Region |
% Change Q4 |
% Change YTD Q4 |
| Athens |
-10.9% |
1.1% |
| Thessaloniki |
10.7% |
2.4% |
| Resort |
6.9% |
10.4% |
Source: GBR Consulting
RevPAR in Competitive Destinations, 2011 compared to 2010
Region |
% Change Q4 |
% Change YTD Q4 |
| S. Europe |
2.3% |
7.3% |
| Rome |
-1.4% |
5.2% |
| Madrid |
0.9% |
2.5% |
| Cairo |
-53.6% |
-51.8% |
Source: STR Global, processed by GBR Consulting
Commentary
- International tourist arrivals at main Greek airports increased overall by 8.65% in 2011. However, the underlying trend for resorts ('Rest of Greece') was even stronger at +13.9%, while Athens (accounting for 25% of all international arrivals at Greek airports in 2011) showed a decline of -3.6%. Thessaloniki airport, which also serves the resort destination of Chalkidiki, also showed a considerable increase of +11.3%. Thessaloniki benefited from LCCs starting operations there and from the opening of new markets in Israel and Turkey, while resort destinations benefited from a number of factors such as the lowering of VAT on accommodation, easing of visa procedures particularly in Russia, new LCC routes at some destinations and unrest in N. Africa.
- In terms of RevPAR, the picture is similar with resort hotels showing a 10.4% increase in RevPAR for 2011, while the cities of Athens and Thessaloniki showed marginal increases of +1.1% and +2.4% respectively. The rise in the RevPAR in Athens, despite declining international arrivals at Athens airport, can probably be attributed to the fact that bed supply has shrunk by ~1,300 following the recent closure of 6 hotels, leading to increased occupancy and demand for hotels continuing operations.
- Comparing with S. European cities, we see that the latter's performance exceeded considerably that of Greek cities, while Cairo continued suffering from the unrest in Egypt.
Hotel & Other News
- In November 2011, Classical Hotels which –like Grecotel– belongs to the Daskalantonakis Group, announced that it would terminate its lease for the 284 rooms 5* Makedonia Palace in Thessaloniki on 27/12/11. Following this, the owner of the hotel, social security organisation IKA, came to an interim agreement with the Daskalantonakis Group, whereby the latter will remain as hotel lessee for the period 14/01/2012 – 31/10/2012. The period can possibly be extended by IKA unilaterally for a further 3 months. Meanwhile, IKA is in the process of selecting an advisor for leasing the property anew.
- According to press reports, the 130 rooms 4* Portes Palace was sold to Russian investors already active in the hospitality industry, for an amount of € 9 – 10 mn. According to the Director of the Portes Group, the move had a strategic nature and did not come as a consequence of the economic crisis.
- From an investment viewpoint, the current crisis has serious implications for hotel values following sharply increased interest rates and a severe liquidity crisis, particularly as banks had been financing hotels based on their value as real estate assets rather than ongoing businesses. So far, this has not come up to the fore as banks have retained hotel loans and associated collateral at historical / face value, in order to avoid writing losses on their balance sheets and bringing down vital adequacy ratios according to the Basle criteria. However, this may change very soon as Blackrock, on the instructions of the Troika, has handed in to the Bank of Greece its report on hidden losses and necessary bank recapitalization needs. If banks are forced to write down the value of hotel loans and associated collateral, they may prefer to force sales of hotels at lower values in order to increase their liquidity.
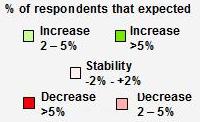
Barometer
- The prospects for the Greek economy remain uncertain. The outcome of negotiations with private holders of Greek debt on the conditions for a "haircut" (PSI: Private Sector Involvement), as well as talks with the Troika on a revised program of economic adjustment remain unclear at this moment.
- This uncertainty is also reflected in our Tourism Barometer survey for 2012 Q1. City Hoteliers, who are heavily dependent on business tourism, are very pessimistic for this first quarter of 2012 on all fronts as shown in the barometers below. Only the hoteliers in Thessaloniki seem positive, especially on their occupancy levels, as the city hosts a large number of Libyans recuperating after the Civil War in Libya.
City hotels
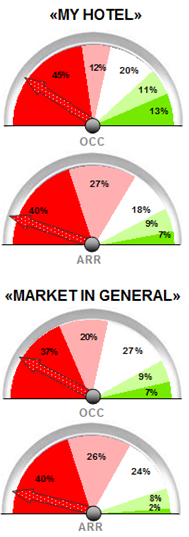
- As shown in the barometers below, hoteliers are clearly pessimistic for 2012 in terms of occupancy levels and room rates compared to 2011for both their own hotels as well as for the market.
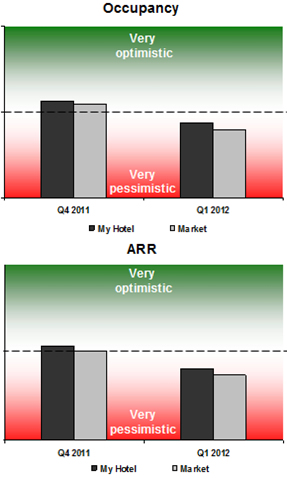
All hotels
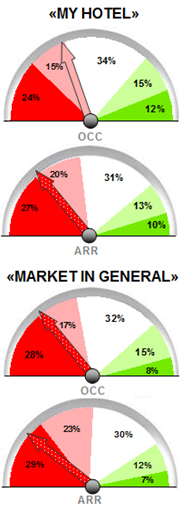
- It also becomes clear that hoteliers have become much more pessimistic for 2012 in the last three months, as at the end of October (see Q4 2011) they were slightly optimistic on occupancy, while expecting stable rates. This quarter, expectations for 2012 are gloomy for both occupancy and ARR.
Endnotes
1 The international arrivals statistics are based on SETE calculations compiling the data from 13 major airports of Greece, representing 95% of foreigners' arrivals by plane in Greece and 72% of total foreigners' arrivals. Thessaloniki airport does not distinguish between arrivals of Greeks and foreigners.
2 RevPAR : Revenue per Available Room; for Greek resorts, calculations are based on TRevPAR (i.e. Total RevPAR).
Download this issue as:
- PDF (259 kb)
Back to newsletter